Posted on
December 5, 2022
by
Warren Shouldice
December is definitely the most popular month for making plans!
If you’re like most homeowners, you’re looking ahead to the new year with hopes and dreams — and perhaps even a few specific goals.
There are likely things you’d like to get done. You may have milestones you hope to reach and accomplishments you aim to attain.
Whatever your plans, I’ll be cheering you on!
Of course, if you’re entertaining the idea of selling and finding your next dream home in 2023, I’m here to help. I can provide you with the market data and insights you need to make an informed decision. If you do decide to move, I can make that happen for you — smoothly and successfully.
So, keep me in mind when you’re making your plans for the new year. I’m a real estate resource you can tap into.
Have a wonderful new year!
Posted on
November 2, 2022
by
Warren Shouldice
The ancient Greek philosopher, Heraclitus, said, “Change is the only constant in life.” Well, that’s certainly true. Things change... Often!
Kids get older. People take on new hobbies. Careers evolve.
As a result, a house that was perfect when the owners originally purchased it may no longer be ideal. That can be the reality even if they’ve only been living there for a short time.
While you may not be in that situation now, you might be in the next few months or years. When that happens, please don't hesitate to reach out to me. I'd be happy to help!
MARKET UPDATE:
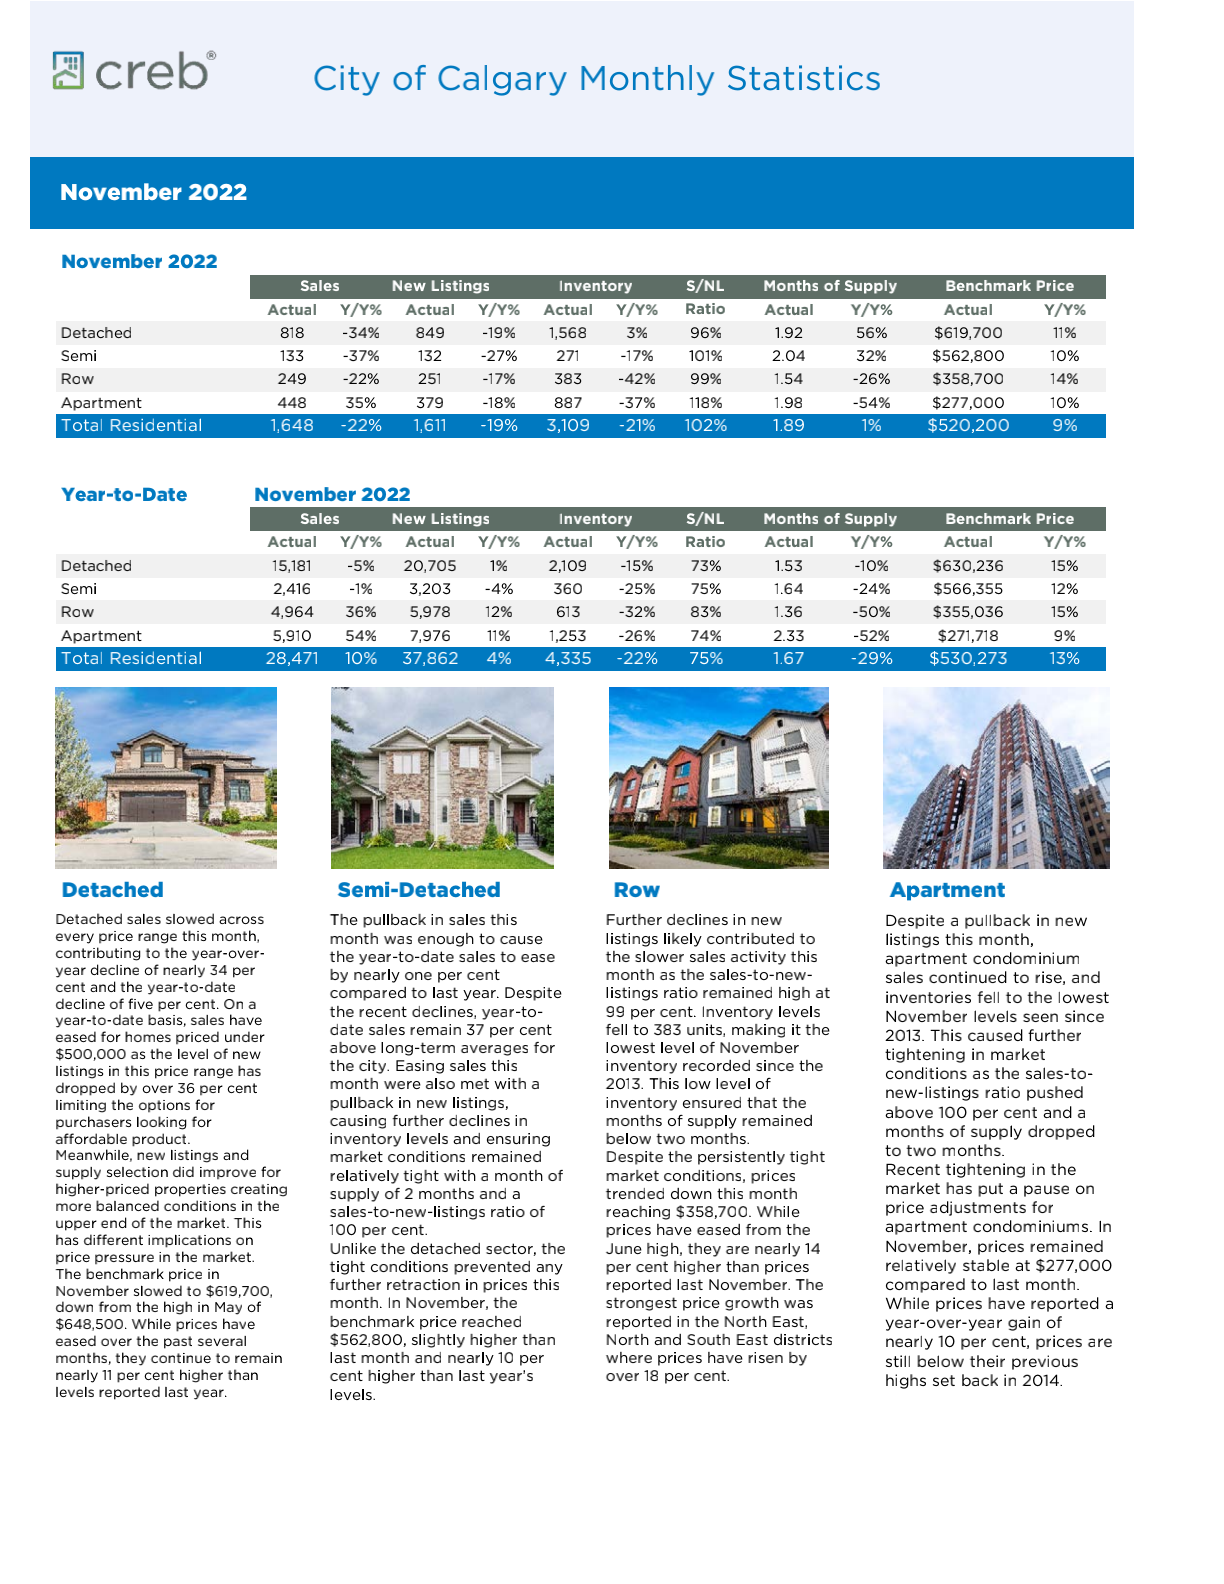
October sales eased compared to last year’s levels, mostly due to slower activity in the detached sector. However, with 1,857 sales this month, levels are still stronger than long-term trends and activity reported prior to the pandemic. Year-to-date sales have reached 26,823 and with only two months to go, 2022 will likely post a record year in terms of sales.
“Calgary hasn’t seen the same degree of pullback in housing sales like other parts of Canada, thanks to persistently strong demand for our higher density product,” said CREB® Chief Economist Ann-Marie Lurie. “While our city is not immune to the impact that inflation and higher rates are having, strong employment growth, positive migration flows and a stronger commodity market are helping offset some of that impact.” New listings also trended down this month causing the sales-to-new-listings ratio to rise to 85 per cent and inventories to trend down. Much of the inventory decline has been driven by product priced below $500,000.
While conditions are not a tight as what was seen earlier in the year, with only two months of supply, conditions remain tighter than historical levels. We are also seeing divergent trends in the market with conditions continuing to favour the seller in the lower-price ranges and shifting to more balanced conditions in the upper-price ranges. As of October, prices have eased by four per cent relative to the highs reached in May. This is considered a relatively small adjustment when considering price movements in other large cities. It is also important to note that the October benchmark price is still nearly 10 per cent higher than levels reported last year.
Posted on
October 6, 2022
by
Warren Shouldice
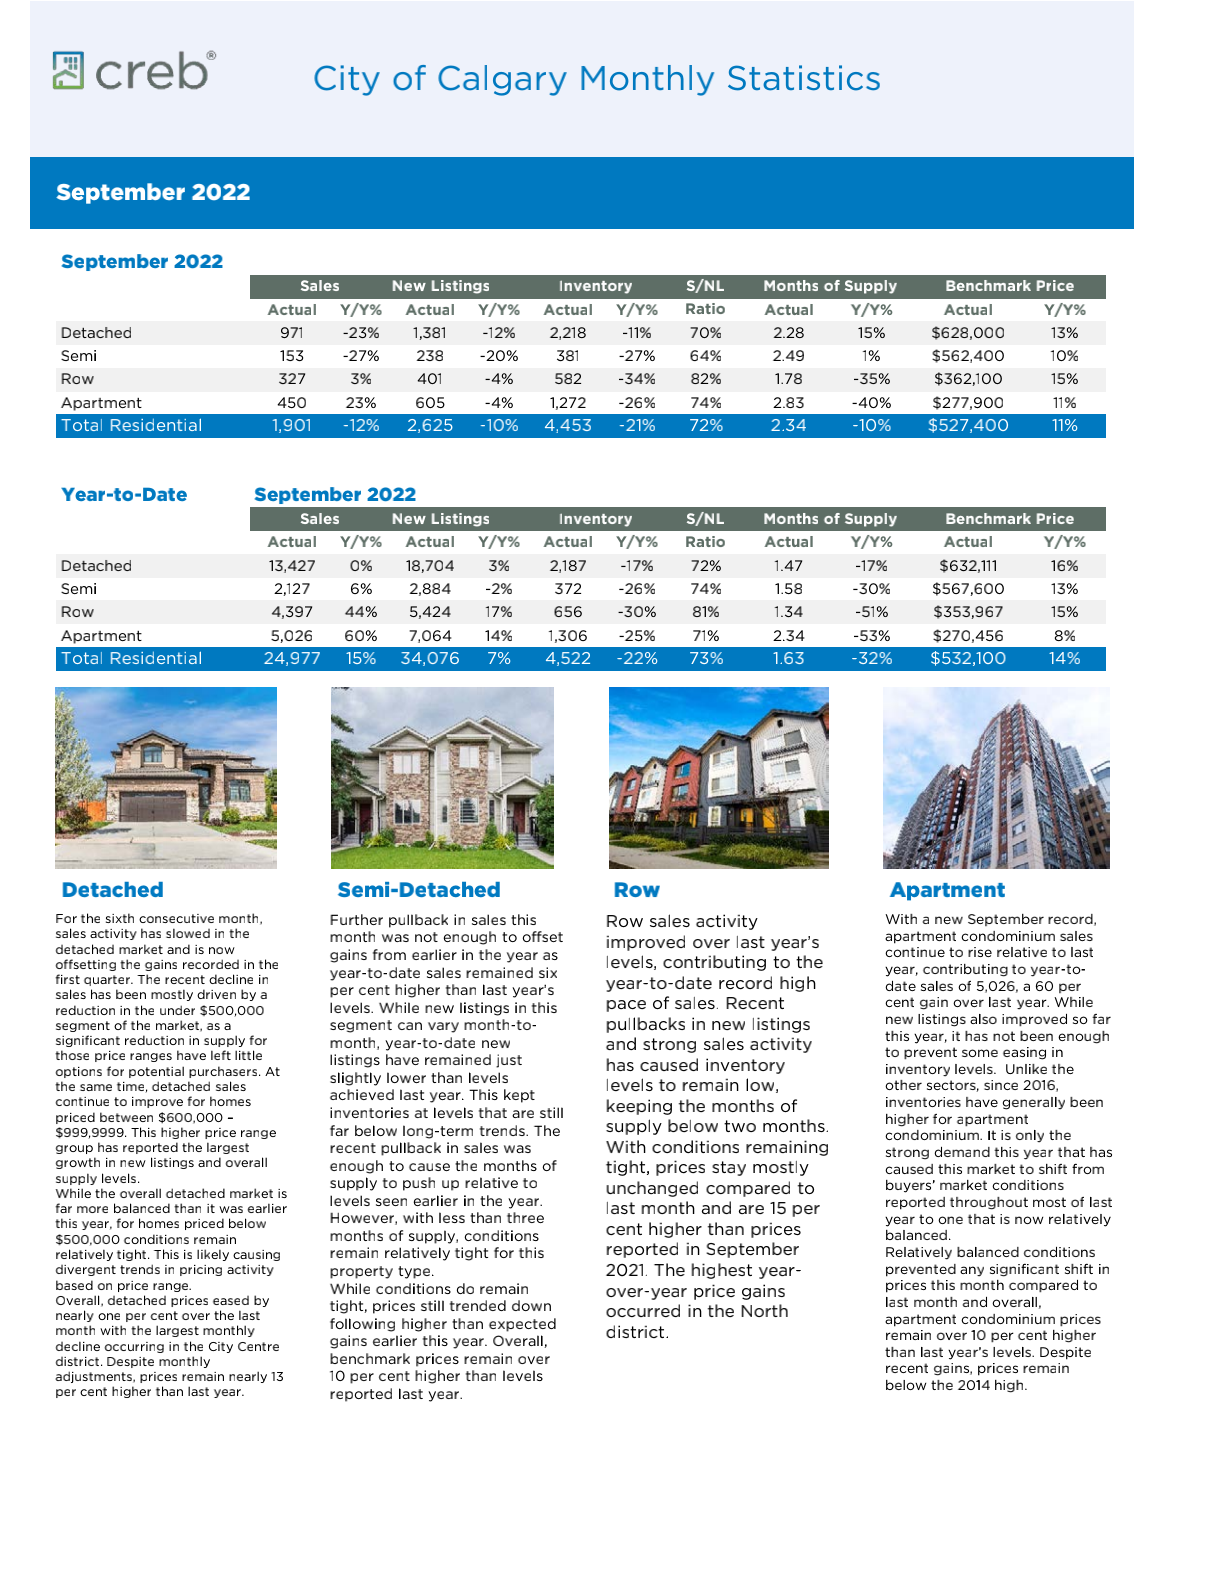
Strong sales for condominium apartment and row properties was not enough to offset declines reported for other property types. This caused city sales to ease by nearly 12 per cent compared to last year.
However, with 1,901 sales in September, activity is still far stronger than levels achieved prior to the pandemic and is well above long-term trends for September. Despite recent pullbacks in sales, and thanks to strong levels earlier in the year, year-to-date sales remain 15 per cent higher than last year’s levels.
The shift to more balanced conditions is causing some adjustments to home prices. While prices have slid from the highs seen in May, as of September, benchmark prices remain 11 per cent higher than last year and six per cent higher than levels reported at the beginning of the year.
Posted on
September 6, 2022
by
Warren Shouldice
If you’re like most people, your home is your most important investment. On the one hand, it’s a financial asset (and hopefully a growing one!) But, on the other hand, it plays a huge role in your overall lifestyle.
So, ideally, your home should be right for you from both a financial and lifestyle standpoint.
Is it?
That’s a question worth answering.
In fact, I recommend that my clients review the financial and lifestyle values of their property at least once a year. It’s helpful to know what your property is worth on today’s market and it’s absolutely vital to know if your home is still supporting the lifestyle you want. (For example, is it now too big or too small for your needs?)
I can help you with that analysis.
Give me a call. I’d be happy to give you a good idea of what your home would likely sell for on today’s market - and help you determine the degree to which your home is fitting the lifestyle you want.

Posted on
October 3, 2021
by
Warren Shouldice
How often has someone asked you about a particular professional or a service company? For example, they may have asked, “Do you know a good tree trimming service?” or “Can you recommend a great accountant?”
Chances are you’ve been asked plenty of times over the years.
The reason is obvious. Most people would prefer to work with a professional or company that a friend or neighbour has endorsed. That’s why they ask for recommendations!
With that in mind, when you get asked, “Do you know a great real estate agent?” I hope you’ll offer my name. If you do, I promise to provide that person with my very best service — as I do for all my clients.
Detached:
Calgary recorded 1,268 sales this month, a significant gain relative to last year and 30 per cent higher than longer-term trends. Sales this month improved across all price ranges except homes priced under $400,000. However, the decline in sales in the lower price range is likely related to limited supply choice. On a year-to-date basis, prices have improved across all districts, with gains that range from a low of five per cent in the City Centre to nearly twelve per cent in the South East. The City Centre is the only district where prices remain below previous highs. The September detached benchmark price of $537,500 has trended down slightly from the record high set in July, but this has not erased earlier gains, as it remains nearly 10 per cent higher than last year.
Semi-Detached:
With less supply choice in the lower price ranges of the detached market, many consumers have turned to the semi-detached sector. With 2,005 sales so far this year, year-to-date sales are over 45 per cent higher than long-term trends and have reached new record highs. The improvement in sales was, in part, related to the improvements in new listings. The sales-to-new listings ratio in this sector has averaged below 70 per cent over the past several months. This is nowhere near as tight as the detached sector, which has averaged 80 per cent. While conditions have not been as tight in the semi-detached sector, there have still been substantial price gains this year. As of September, the benchmark price was $424,900, slightly lower than last month, but over eight per cent higher than last year’s levels. Like the detached sector, the semidetached sector’s slowest price growth has occurred in the City Centre. On a year-to-date basis, prices remained below previous highs in the City Centre, North East and South districts.
Row:
With 318 sales this month, year-to-date sales pushed up to 3,057 units, which is 62 per cent above long-term trends and on pace to hit record levels this year. Sales have risen across every district, with the largest growth recorded in the South East district. While new listings did improve this month, it was not enough to prevent further declines in Inventory levels. The months of supply remained relatively low at less than three months, which is well below traditional levels for this time of year. Tighter conditions have supported price growth across all districts so far in 2021. However, unlike the detached and semi-detached sectors, row prices remain below previous highs across all districts in the city.
Apartment:
A boost in new listings this month translated into some gains in sales activity. However, with a sales-to new-listings ratio of 58 per cent, inventories still trended up relative to the previous month and last year’s levels. The months of supply remained just below five months in September, far lower than levels recorded last year and over the past five years. Conditions have generally been more balanced for this property type compared with other sectors, preventing strong price gains. On a year-to date basis, citywide benchmark prices improved by nearly three per cent, but they remain over 14 per cent lower than previous highs.
Quick Stats:
| |
Sep. 2020
|
Sep. 2021
|
Y/Y% change
|
|
Detached
|
|
|
|
|
Total sales
|
1,055
|
1,268
|
20.19%
|
|
Inventory
|
3,065
|
2,496
|
-18.56%
|
|
Months of supply*
|
2.91
|
1.97
|
-32.24%
|
|
Benchmark price**
|
$488,800
|
$537,500
|
9.96%
|
| |
|
|
|
|
Semi-Detached
|
|
|
|
|
Total sales
|
153
|
210
|
37.25%
|
|
Inventory
|
596
|
517
|
-13.26%
|
|
Months of supply*
|
3.90
|
2.46
|
-36.80%
|
|
Benchmark price**
|
$391,900
|
$424,900
|
8.42%
|
| |
|
|
|
|
Row
|
|
|
|
|
Total sales
|
256
|
318
|
24.22%
|
|
Inventory
|
949
|
876
|
-7.69%
|
|
Months of supply*
|
3.71
|
2.75
|
-25.69%
|
|
Benchmark price**
|
$279,400
|
$299,600
|
7.23%
|
| |
|
|
|
|
Apartment
|
|
|
|
|
Total sales
|
242
|
366
|
51.24%
|
|
Inventory
|
1,638
|
1,718
|
4.88%
|
|
Months of supply*
|
6.77
|
4.69
|
-30.65%
|
|
Benchmark price**
|
$250,100
|
$253,200
|
1.24%
|
*Months of supply: The ratio between inventory and sales which represents the current pace of sales and how long it would take to clear existing inventory.
**Benchmark price: The monthly price of the typical home based on its attributes, providing the best measure of price trends.
DIY Friendly Bathroom Makeovers
- Update the sink. If you have some basic plumbing knowledge, this is a project you should be able to do on your own. A new sink can make the entire vanity look like new.
- Buy new decor. New shower curtains, towels, window coverings, mats, etc. can transform the look of a bathroom.
- Install new hardware. Replacing cabinet hardware may not seem like much of a change. However, it can have a surprisingly big impact. Shiny new hardware is like jewelry. It stands out.
- Replace the vanity mirror. Even if there are no scratches, an older mirror is like an old pair of glasses. It can become foggy. No amount of cleaning will make it any clearer. When ordering a replacement mirror, be sure that your measurements are exact.
- Paint. There’s no doubt about it. A fresh coat of paint makes any room look better.
These bathroom improvement projects can make a huge impact on the look of your bathroom. And, they can all be done affordably and in just a day or two.
Posted on
July 8, 2021
by
Warren Shouldice
Calgary’s housing market is showing few signs of letting up, as sales reached 2,915 units in June – a record high for the month.New listings in June totalled 4,135, the second-highest level ever recorded for the month. This caused inventories to trend up to 6,918 units. While this is higher than longer-term averages, it was balanced by strong sales and the months of supply remained relatively tight at 2.4 months. However, this is still an improvement from earlier in the year when the months of supply was below two.
As the market moves toward more balanced conditions, we are also starting to see the pace of price growth slow. The benchmark home price continued to trend up in June, but the monthly gain slowed to less than one per cent. While the pace of growth is slowing, as of June, the benchmark price was 11 per cent higher than levels recorded last year.
Detached
Despite some modest improvements in inventory levels, strong sales in June have kept the detached sector of the market firmly in sellers’ market conditions.Despite the sellers’ market conditions in the detached sector, there is some variation depending on location. The districts with the strongest demand relative to supply are the North, North West, South, South East and East districts. Each of these districts has less than two months of supply in June, which is well below longer-term averages. The tightness in these areas has also resulted in the highest year-over-year price gains.
The City Centre has not experienced the same tight conditions as other districts and is the only district where detached prices have yet to recover from previous highs.
Semi-Detached
The pace of semi-detached sales growth is showing some signs of slowing, but year-to-date sales remain at record highs. New listings have also reached new highs so far this year. However, the growth in sales has outpaced the growth in new listings, preventing any significant shift in inventory levels.
The persistent sellers’ market conditions have caused benchmark prices to trend up, reaching $427,000 in June. Gains have occurred across all districts so far this year, but the amount of growth has ranged from a low of less than five per cent to a high of nearly 10 per cent. Despite these gains, only the North, West and South East districts have seen prices recover to previous highs.
Row
After the first half of the year, row sales totalled 2,045, their highest mark since 2007. Those sales have been met with record-high new listings. This has caused inventories to trend up over recent months to levels higher than what we typically see at this time of year.
The higher inventories have not been a problem, as they’ve been balanced by strong sales. The month of supply remains below three months and this sector continues to favour the seller. Recent gains in the months of supply are helping the market move toward more balanced conditions, but it is too soon to see the shift impact pricing.
In June, citywide row prices totalled $299,300, one per cent higher than last month and nine per cent higher than last year’s levels. Prices have improved across most districts, but they remain well below previous highs.
Apartment
Recent price gains have encouraged more people to sell their condominiums this year, causing both new listings and overall inventories to increase relative to the previous year. At the same time, relative affordability has supported sales totals that have improved from the exceptionally low levels recorded over the previous six years.
The result has been inventories that remain elevated compared to historical levels, but strong sales have helped bring the months of supply down to levels more consistent with balanced market conditions.
The balanced conditions have been supporting some price recovery in the market. Prices have trended up over the first half of the year and on a year-to-date basis they currently sit nearly three per cent higher than last year.
Prices have risen across all districts, but the largest price gain occurred in the West district. However, overall, prices remain nearly 15 per cent below previous highs.
Quick Stats:
| |
June 2020
|
June 2021
|
Y/Y% change
|
|
Detached
|
|
|
|
|
Total sales
|
1,103
|
1,819
|
64.91%
|
|
Inventory
|
3,274
|
3,261
|
-0.40%
|
|
Months of supply*
|
2.97
|
1.79
|
-39.60%
|
|
Benchmark price**
|
$475,100
|
$537,200
|
13.07%
|
| |
|
|
|
|
Semi-Detached
|
|
|
|
|
Total sales
|
185
|
243
|
31.35%
|
|
Inventory
|
641
|
592
|
-7.64%
|
|
Months of supply*
|
3.46
|
2.44
|
-29.69%
|
|
Benchmark price**
|
$384,000
|
$427,000
|
11.20%
|
| |
|
|
|
|
Row
|
|
|
|
|
Total sales
|
243
|
411
|
69.14%
|
|
Inventory
|
965
|
1,101
|
14.09%
|
|
Months of supply*
|
3.97
|
2.68
|
-32.54%
|
|
Benchmark price**
|
$274,700
|
$299,300
|
8.96%
|
| |
|
|
|
|
Apartment
|
|
|
|
|
Total sales
|
232
|
442
|
90.52%
|
|
Inventory
|
1,562
|
1,964
|
25.74%
|
|
Months of supply*
|
6.73
|
4.44
|
-34.00%
|
|
Benchmark price**
|
$240,700
|
$253,000
|
5.11%
|
*Months of supply: The ratio between inventory and sales which represents the current pace of sales and how long it would take to clear existing inventory.
**Benchmark price: The monthly price of the typical home based on its attributes, providing the best measure of price trends.
The Latest Options in Outdoor Lighting
Outdoor lighting has come a long way from the days of patio lanterns and strings of lightbulbs. These days, there’s an exhaustive array of options available to illuminate your outdoor space, and make it more appealing and comfortable, particularly in the evenings.
Here are just a few ideas:
Solar garden lights. These lights are on stakes that can be easily inserted throughout the garden. Powered by the sun, they generate enough energy to cast a soft, pleasant glow along walkways or in flower beds in the evenings.
Deck post lights. These are easy to install because they’re designed to sit on top of a standard 4x4 wood deck post. Most are solar powered.
Street-style lamps. As the name implies, these look similar to old-fashioned street lamps. Installation is a little more complex, but still DIY-friendly. They’re eye-catching and have a dramatic impact on the look of your outdoor space.
Portable lantern lights. These are outdoor lights that are portable and often made to look like a decorative fixture for a coffee table or side table. They can be placed anywhere.
LED walkway lights. These are small lights that fit neatly and almost invisibly under stairs and around walkways. Walkway lights not only look good but also improve safety. Most are battery powered.
Planter lights. This is one of the most interesting options. Each one is both a flower pot and a light in one! The pot itself is translucent which allows the light inside to shine through.
Design experts say you should treat your outdoor space as you would any room in your home. Lighting it up for evening comfort and enjoyment is a good place to start.
Posted on
April 4, 2021
by
Warren Shouldice
The initial impact of COVID-19 on the housing market began last March. One year later, it is not a surprise that March sales in 2021 were higher than in 2020. However, at 2,903 sales, this was the highest March total since 2007. Inventory levels pushed above 5,400 units, but citywide months of supply fell below two months. This reflects the lowest months of supply for March since 2014 and these tight conditions have contributed to price gains. In March, the benchmark price trended up over last month to $441,900, over six per cent higher than last year’s levels. The price gains have moved the market closer to recovery, but prices remain over five per cent lower than 2014 highs.
Detached
Like last month, detached sales activity improved across most price ranges and all districts in the city. While new listings did improve, inventory levels remained relatively low at 2,409 units, causing the months of supply to drop to just over one month. The citywide detached benchmark price rose by nearly eight per cent compared to last year. Year-over-year gains ranged from a low of nearly three per cent in the City Centre to a high of nearly 11 per cent in the North and South East districts. Prices in most districts remain below previous monthly highs, but recent gains in both the North and South East have supported full price recovery in those areas. Product priced under $400,000 recorded the lowest sales growth, as limited inventory weighed on that segment of the market. However, rising sales and easing inventory resulted in tighter market conditions across all price ranges. This is likely supporting price gains, not only in the mid and lower price ranges, but also the upper price ranges in the market.
Semi-Detached
Steady gains in sales caused first quarter sales totals to reach nearly record highs for this property type. Improving new listings were not enough to offset the sales and the months of supply fell below two months for the first time since 2014. Low supply levels relative to sales contributed to further gains in prices, which, as of March, were nearly six per cent higher than last year’s levels. Benchmark prices trended up across all districts and prices remained higher than last year’s levels across most districts. The largest year-over-year price gains occurred in the North district, with an increase of nearly 10 per cent.
Row
Echoing the results of other property types, sales activity for row properties has risen far above long-term averages. However, it is the first time since 2014 that the months of supply has fallen below three months. The row-property market has taken longer to see tighter conditions, but the recent tightening is starting to have a more significant impact on price. As of March, row benchmark prices rose to $288,800, nearly three per cent higher than last year. However, activity was not consistent across all districts. The largest price gains occurred in the City Centre and West districts. Despite recent gains, prices remain well below previous highs.
Apartment
For the third month in a row, sales activity was stronger than the previous year. New listings also rose and is causing some inventory gains. Despite the inventory gains, sales have been far better than levels seen over the past six years and the months of supply did trend down to the lowest March levels since 2014. Tightening conditions did support some year-over-year price gains in this segment. After experiencing falling prices for the better part of five years, this change is a welcome shift for most sellers. However, prices remain nearly 17 per cent below the 2014 highs.
Quick Stats:
| |
March. 2020
|
March. 2021
|
Y/Y% change
|
|
Detached
|
|
|
|
|
Total sales
|
689
|
1,866
|
170.83%
|
|
Inventory
|
2,890
|
2,409
|
-16.64%
|
|
Months of supply*
|
4.19
|
1.29
|
-69.22%
|
|
Benchmark price**
|
$478,400
|
$516,300
|
7.92%
|
| |
|
|
|
|
Semi-Detached
|
|
|
|
|
Total sales
|
115
|
269
|
133.91%
|
|
Inventory
|
632
|
444
|
-29.75%
|
|
Months of supply*
|
5.50
|
1.65
|
-69.97%
|
|
Benchmark price**
|
$389,000
|
$410,900
|
5.63%
|
| |
|
|
|
|
Row
|
|
|
|
|
Total sales
|
152
|
383
|
151.97%
|
|
Inventory
|
900
|
877
|
-2.56%
|
|
Months of supply*
|
5.92
|
2.29
|
-61.33%
|
|
Benchmark price**
|
$281,000
|
$288,800
|
2.78%
|
| |
|
|
|
|
Apartment
|
|
|
|
|
Total sales
|
218
|
385
|
76.61%
|
|
Inventory
|
1,441
|
1,686
|
17.00%
|
|
Months of supply*
|
6.61
|
4.38
|
-33.75%
|
|
Benchmark price**
|
$242,500
|
$250,000
|
3.09%
|
*Months of supply: The ratio between inventory and sales which represents the current pace of sales and how long it would take to clear existing inventory.
**Benchmark price: The monthly price of the typical home based on its attributes, providing the best measure of price trends.
Posted on
March 5, 2021
by
Warren Shouldice
In February residential sales totalled 1,836 units, representing the best February since 2014. In just a few months the Calgary market has caught fire, particularly in the detached segment with year-over-year benchmark prices jumping as much as 9% in some areas of the city.
“Despite continued COVID-19 restrictions, housing activity continues to improve. Much of the strong sales activity is expected to be driven by exceptionally low mortgage rates,” said CREB® chief economist Ann-Marie Lurie. “Confidence is also likely improving as vaccine rollouts are underway. Additionally, some of the worst fears concerning the energy sector are easing with recent gains in energy prices.” New listings also improved in February, but the gap between new listings and sales narrowed. This is causing the sales-to-new-listings ratio to rise to 65 per cent, keeping the months of supply well below three months. Conditions are far tighter in the detached sector of the market, especially for product priced below $600,000, where strong sellers’ market conditions are present with less than two months of supply. The market has faced relatively low inventory levels compared to sales for the past several months and prices continue to trend up. In February, the residential benchmark price rose over the previous month and currently sits four per cent above last years’ levels. Detached product has the lowest months of supply and is also exhibiting the most significant gains in prices. On the opposite end of the spectrum, the apartment condominium segment still has a relatively high level of inventory compared to sales, which is impacting price recovery for this property type.
As always, market conditions vary widely based on price, product type and location. For more information, or if you have any questions please don't hesitate to contact me!
Quick Stats
| |
Feb. 2020
|
Feb. 2021
|
Y/Y% change
|
|
Detached
|
|
|
|
|
Total sales
|
678
|
1,123
|
65.63%
|
|
Inventory
|
2,748
|
1,927
|
-29.88%
|
|
Months of supply*
|
4.05
|
1.72
|
-57.66%
|
|
Benchmark price**
|
$478,400
|
$502,500
|
5.04%
|
| |
|
|
|
|
Semi-Detached
|
|
|
|
|
Total sales
|
139
|
181
|
30.22%
|
|
Inventory
|
604
|
366
|
-39.40%
|
|
Months of supply*
|
4.35
|
2.02
|
-53.46%
|
|
Benchmark price**
|
$384,800
|
$398,300
|
3.51%
|
| |
|
|
|
|
Row
|
|
|
|
|
Total sales
|
164
|
260
|
58.54%
|
|
Inventory
|
851
|
792
|
-6.93%
|
|
Months of supply*
|
5.19
|
3.05
|
-41.30%
|
|
Benchmark price**
|
$281,200
|
$284,700
|
1.24%
|
| |
|
|
|
|
Apartment
|
|
|
|
|
Total sales
|
209
|
272
|
30.14%
|
|
Inventory
|
1,470
|
1,433
|
-2.52%
|
|
Months of supply*
|
7.03
|
5.27
|
-25.10%
|
|
Benchmark price**
|
$244,500
|
$246,400
|
0.78%
|
*Months of supply: The ratio between inventory and sales which represents the current pace of sales and how long it would take to clear existing inventory.
**Benchmark price: The monthly price of the typical home based on its attributes, providing the best measure of price trends.
What to do When Closing Dates Don't Match
If you want to sell your current property and purchase your next dream home, you might be wondering whether the closing dates need to be on the same day.
You might even be worried that you’ll lose a property if the closing dates overlap, or you’ll be put out on the street if the dates are far apart! For the most part, these concerns are unfounded. Thousands of properties change hands every day and usually everything works out just fine. In fact, it’s amazing how often closing dates actually do match! But, what happens if the closing date of the home you want to buy is days or weeks earlier than the closing date of your own property? Most lenders anticipate this situation and offer something called “Bridge Financing.” It is a special loan that allows you to purchase the property with the earlier closing date. When your current property closes, the bridge financing ends and your new mortgage – if you need one – begins on the new home.
Posted on
February 6, 2021
by
Warren Shouldice
January sales were the highest they have been for the month since 2014, as housing market momentum from the end of 2020 carried over into the start of 2021. Sales activity improved across all product types and across all price ranges. “Discount lending rates are exceptionally low, which is likely attracting all types of buyers back into the market,” said CREB® chief economist Ann-Marie Lurie. “New listings in the market were also slightly higher than what was available over the past two months, which is providing more options to purchasers.” January’s new listings were 2,246 relative to the 1,208 sales in the market, causing inventories to edge up over December levels. These types of movements are typical for January, but 2021 is starting the year with 4,035 units in inventory. This is far lower than the past six years. Benchmark prices remained at levels relatively consistent with prices recorded at the end of 2020, but they reflect a year-over-year gain just below two per cent. Average and median prices recorded higher year-over-year gains, likely due to larger gains in sales in the higher end of the market. Those segments do not have the same inventory constraints as lower-priced product.
Quick Stats:
| |
Jan. 2020
|
Jan. 2021
|
Y/Y% change
|
|
Detached
|
|
|
|
|
Total sales
|
515
|
731
|
41.94%
|
|
Inventory
|
2,487
|
1,683
|
-32.33%
|
|
Months of supply*
|
4.83
|
2.30
|
-52.32%
|
|
Benchmark price**
|
$478,900
|
$492,900
|
2.92%
|
| |
|
|
|
|
Semi-Detached
|
|
|
|
|
Total sales
|
84
|
141
|
67.86%
|
|
Inventory
|
576
|
338
|
-41.32%
|
|
Months of supply*
|
6.86
|
2.40
|
-65.04%
|
|
Benchmark price**
|
$386,400
|
$391,300
|
1.27%
|
| |
|
|
|
|
Row
|
|
|
|
|
Total sales
|
113
|
150
|
32.74%
|
|
Inventory
|
764
|
697
|
-8.77%
|
|
Months of supply*
|
6.76
|
4.65
|
-31.27%
|
|
Benchmark price**
|
$279,400
|
$280,900
|
0.54%
|
| |
|
|
|
|
Apartment
|
|
|
|
|
Total sales
|
147
|
186
|
26.53%
|
|
Inventory
|
1,341
|
1,317
|
-1.79%
|
|
Months of supply*
|
9.12
|
7.08
|
-22.38%
|
|
Benchmark price**
|
$246,100
|
$245,100
|
-0.41%
|
*Months of supply: The ratio between inventory and sales which represents the current pace of sales and how long it would take to clear existing inventory.
**Benchmark price: The monthly price of the typical home based on its attributes, providing the best measure of price trends.
Avoiding Moisture Problems in the Home
There are many hidden sources of moisture in your home that can lead to serious problems, such as mould.
To keep moisture levels in check, consider these tips:
- Bathrooms are an obvious source of moisture build-up. Contractor and TV personality Mike Holmes recommends keeping the fan going for at least half an hour after a shower.
- Check regularly for water infiltration around window and door sills, as well as other intakes into the home, such as dryer vents and cable wiring.
- Determine the humidity level in your home. According to the Environmental Protection Agency, it should be 30-60%. (Keep in mind that humidity may vary greatly from room to room.)
- Regularly inspect caulking around sinks, tubs and showers. Even a tiny break can cause water to leak gradually into the wall or floor, causing damage you may not notice for months.
- Clean up wet spills as soon as possible. Be particularly careful with hardwood floors, as water can seep through and become trapped.
- Repair leaking faucets and pipes immediately. Even a small drip can add significant moisture inside a vanity or kitchen cupboard.
Being mindful of moisture today can help you avoid potentially high repair bills later on.
Posted on
December 13, 2020
by
Warren Shouldice
Welcome to December! The last month of a year many of us would rather forget. Yes, 2020's been a bit of a train wreck, but at least there's some light at the end of the tunnel. I know I'm certainly looking forward to the new year. Whatever your hopes and plans are for 2021, I wish you nothing but good health, happiness and success!
Market Update:
For the sixth month in a row, sales in the Calgary market recorded a year-over-year gain. Sales growth over the past several months has been the strongest seen in the past five years, but the activity has not been strong enough to offset the pullbacks from the spring. Year-to-date sales remain over three per cent lower than last year's levels.
New listings continue to slow, reducing inventory in the market. On a year-to-date basis, new listings have eased by nearly ten per cent and are at the lowest level recorded since 2001. This has reduced the oversupply that has been impacting the market for nearly five years.
"The gains in sales in the latter part of this year have been a bit surprising considering the job losses and unemployment rate in our city," said CREB® chief economist Ann-Marie Lurie. "However, it is important to note that the shift to more balanced conditions has been mostly driven by the reduction of supply."
Tighter conditions in the housing market have contributed to some of the recent gains in benchmark prices. As of November, the benchmark price was $423,600. This is nearly two per cent higher than last year's levels.
However, conditions vary depending on price range. There is not a lot of supply for affordable homes in each product type because of high demand. This is likely causing differing price trends in the lower end of the market versus the higher end.
Quick Stats:
| |
Nov. 2019
|
Nov. 2020
|
Y/Y% change
|
|
Detached
|
|
|
|
|
Total sales
|
703
|
883
|
25.60%
|
|
Inventory
|
3,002
|
2,244
|
-25.25%
|
|
Months of supply*
|
4.27
|
2.54
|
-40.49%
|
|
Benchmark price**
|
$478,200
|
$492,000
|
2.89%
|
| |
|
|
|
|
Semi-Detached
|
|
|
|
|
Total sales
|
101
|
152
|
50.50%
|
|
Inventory
|
661
|
452
|
-31.62%
|
|
Months of supply*
|
6.54
|
2.97
|
-54.56%
|
|
Benchmark price**
|
$390,000
|
$395,100
|
1.31%
|
| |
|
|
|
|
Row
|
|
|
|
|
Total sales
|
154
|
191
|
24.03%
|
|
Inventory
|
890
|
822
|
-7.64%
|
|
Months of supply*
|
5.78
|
4.30
|
-25.53%
|
|
Benchmark price**
|
$280,900
|
$282,200
|
0.46%
|
| |
|
|
|
|
Apartment
|
|
|
|
|
Total sales
|
188
|
211
|
12.23%
|
|
Inventory
|
1,431
|
1,510
|
5.52%
|
|
Months of supply*
|
7.61
|
7.16
|
-5.98%
|
|
Benchmark price**
|
$248,100
|
$245,400
|
-1.09%
|
*Months of supply: The ratio between inventory and sales which represents the current pace of sales and how long it would take to clear existing inventory.
**Benchmark price: The monthly price of the typical home based on its attributes, providing the best measure of price trends.
Avoiding the #1 Cause of Seller Stress
Do you know what causes the most common source of stress when selling your home? Is it scheduling buyer viewings? Is it the length of time it takes for your property to sell? Is it an offer that falls through? Those things can, indeed, cause some worry! But, the number one source of stress is actually simple to avoid. It’s not understanding the process.
Even if you’re no stranger to moving, you should review the process involved in selling your current home before you list it. If you don’t, you might end up exposing yourself to anxiety that could have been easily avoided. Say, for example, you’re concerned that your home has been listed for too long. It’s been a week and no good offers have come in. Well, if you knew, in advance, how long a home like yours typically takes to sell, then you probably would know not to worry.
It’s important that you start the process by understanding what to expect. What happens when your home is first listed? How are buyers scheduled to see your property? What happens when an offer comes in? That’s why we will always review the selling process before you list and make sure all your questions are answered.
Posted on
November 3, 2020
by
Warren Shouldice
Happy autumn. Let’s hope the coming season treats us all well!
Speaking of seasons, you may have noticed that the real estate market seems to have seasons. Traditionally, it’s slower in some months and busier in others. In fact, that might lead you to try to “time” the market and sell when it’s hot. But, be careful. Like the weather, the real estate market can be unpredictable. Yes, it may be active next spring – but, then again, it could be slow. There’s no way to know for sure. In fact, the best criteria for deciding whether or not to sell your property isn’t as much the market as it is your personal wishes. If you want to move within the next couple of months, there are ways to make that happen.
So, don’t let market conditions delay or derail your plans to move. Properties sell in all kinds of markets, and yours can too!
Market Stats:
| |
Oct. 2019
|
Oct. 2020
|
Y/Y% change
|
|
Detached
|
|
|
|
|
Total sales
|
846
|
1,139
|
34.63%
|
|
Inventory
|
3,498
|
2,736
|
-21.78%
|
|
Months of supply*
|
4.13
|
2.40
|
-41.90%
|
|
Benchmark price**
|
$481,200
|
$489,800
|
1.79%
|
| |
|
|
|
|
Semi-Detached
|
|
|
|
|
Total sales
|
144
|
174
|
20.83%
|
|
Inventory
|
710
|
559
|
-21.27%
|
|
Months of supply*
|
4.93
|
3.21
|
-34.84%
|
|
Benchmark price**
|
$398,300
|
$394,700
|
-0.90%
|
| |
|
|
|
|
Row
|
|
|
|
|
Total sales
|
200
|
217
|
8.50%
|
|
Inventory
|
962
|
909
|
-5.51%
|
|
Months of supply*
|
4.81
|
4.19
|
-12.91%
|
|
Benchmark price**
|
$290,700
|
$274,400
|
-5.61%
|
| |
|
|
|
|
Apartment
|
|
|
|
|
Total sales
|
248
|
234
|
-5.65%
|
|
Inventory
|
1,492
|
1,629
|
9.18%
|
|
Months of supply*
|
6.02
|
6.96
|
15.71%
|
|
Benchmark price**
|
$251,800
|
$248,600
|
-1.27%
|
*Months of supply: The ratio between inventory and sales which represents the current pace of sales and how long it would take to clear existing inventory.
**Benchmark price: The monthly price of the typical home based on its attributes, providing the best measure of price trends.
Protecting your Home Gadgets from Hacking
Imagine your coffee maker switching on by itself, staying on for hours, overheating and becoming a fire hazard. That’s not science fiction. As more and more appliances incorporate WIFI, the opportunities for hackers to play havoc with them increase.
How do you prevent that from happening? Here are some safety tips:
- If your gadget uses a password to access the settings, change that password frequently. Ideally, change it once every 3 months.
- Some gadgets, such as alarm systems, come with their own connection to the internet. Learn how to turn that connection off if it becomes necessary to do so.
- Don’t leave an internet-connected appliance or other gadget on constantly unless it’s necessary. For example, you don’t need your home speaker system connected to your digital music providers all the time.
- Baby monitors with video are a common target for hackers. Use a password unique to that device and change it often. Never leave the monitor on when not in use.
- Never share passwords with anyone unless it is absolutely necessary. Most home WIFI systems have a “guest” feature with a separate password and limited access. Use it.
In this age of internet connectivity — from coffee makers to stereos and even washing machines — it’s smart to play it safe. Know what’s connected and protect yourself.
Posted on
June 7, 2020
by
Warren Shouldice
If you’re like most homeowners, you’ve probably found these past few weeks challenging to say the least. Although the experts say we are making progress, we’re still trying to find our footing on an uncertain road. We’re figuring out how to live and work in new ways.
In fact, when it comes to real estate, you may be wondering, “How does the selling/buying process work in times like these?” or, if you want to sell, “Is now a good time or should I wait?”
If you’re looking for answers, please reach out to me. Yes, there have been changes in how the buying/selling process works, and I’m happy to fill you in. In fact, if you have any questions or need any help that’s real estate related, feel free to contact me!
Market Update:
Housing market activity in May remained slow, but sales exceeded the lows from April, which saw less than 600 sales in Calgary.
May sales totalled 1,080 units, a 44 per cent decline from last year’s figures. “The initial shock of COVID-19 and social distancing measure is starting to ease. This is bringing some buyers and sellers back to the market. However, this market continues to remain far from normal and prices are trending down,” said CREB® chief economist Ann-Marie Lurie. “Activity has also shifted toward more affordable product, which is likely causing differing trends depending on product type and price range.”
Sales are down in all price ranges, but a greater share of sales are priced below $500,000. In the higher price ranges the drop in inventory has not been enough compared to the drop in sales. Additionally, the months of supply is far higher than the already elevated levels seen during the past five years. The shift in sales toward lower-priced product is contributing to steep average price declines in the Calgary market. Benchmark pricing, which reflects comparisons of the same type of home, has eased by over two per cent compared to last year and 0.4 per cent compared to last month. This does not come as a surprise as the market continues to struggle with more supply than demand.
COVID-19 and social distancing measures have contributed to rising unemployment rates and job losses throughout many economic sectors. This is weighing on consumer confidence and the housing market. Some of this job loss is temporary, but the energy sector remains the largest concern. Significant job loss throughout the typically higher-paid professional and technical services sector points to a longer adjustment period in the housing market, particularly in the higher end of the market.
Quick Stats:
| |
May 2019
|
May 2020
|
Y/Y% change
|
|
Detached
|
|
|
|
|
Total sales
|
1,180
|
670
|
-43.22%
|
|
Inventory
|
3,931
|
2,922
|
-25.67%
|
|
Months of supply*
|
3.33
|
4.36
|
30.91%
|
|
Average DOM
|
50
|
55
|
6.84%
|
|
Benchmark price**
|
$484,300
|
$474,300
|
-2.06%
|
| |
|
|
|
|
Attached
|
|
|
|
|
Total sales
|
422
|
273
|
-35.31%
|
|
Inventory
|
1,902
|
1,503
|
-20.98%
|
|
Months of supply*
|
4.51
|
5.51
|
22.15%
|
|
Average DOM
|
61
|
71
|
15.74%
|
|
Benchmark price**
|
$318,600
|
$306,500
|
-3.80%
|
| |
|
|
|
|
Apartment
|
|
|
|
|
Total sales
|
313
|
137
|
-56.23%
|
|
Inventory
|
1,654
|
1,388
|
-16.08%
|
|
Months of supply*
|
5.28
|
10.13
|
91.72%
|
|
Average DOM
|
70
|
67
|
-4.77%
|
|
Benchmark price**
|
$248,400
|
$242,600
|
-2.33%
|
*Months of supply: The ratio between inventory and sales which represents the current pace of sales and how long it would take to clear existing inventory.
**Benchmark price: The monthly price of the typical home based on its attributes, providing the best measure of price trends.
Predicting Your Future Housing Needs
What will your housing needs be in three to five years? If you can figure that out, you can watch the market, target areas and neighbourhoods you might like to live in, and reap the benefits of planning ahead.
To begin the process, start by asking yourself the following questions:
- What will my family look like in three to five years? Will there be a new addition (or two) to your family? Will you have kids that are grown up and about to move out? What is the possibility that an elderly relative (Mom, Dad or grandparent) will be living with you?
- What will change regarding work and school? Will a teenager be off to college? Will you or your spouse be retired? Will someone in your household be starting a home business?
- How will your lifestyle be different? Will you take up a hobby that you’d like to be able to reach easily (such as golf)? Do you see yourself wanting to live closer to shopping, theatre, walks in the woods, etc.? Will you eventually be traveling more often and, therefore, not be at home as much?
- How is the neighbourhood changing? Where is it heading relative to your future needs in terms of residents, noise, sense of community, local developments, etc.? Do you see yourself wanting to live in a quieter community, or a more urban centre?
- Will the type of home you need change? In three to five years, can you see yourself wanting a larger home? Smaller home? More bedrooms? Larger kitchen?
- What are your dreams? Do you dream of living in a particular area or neighbourhood? Would you love to have a big backyard with a garden someday? Do you sometimes think, “It would be great to have a wooded park with walking trails just a few minutes away.”
By looking three to five years into the future, you will be able to predict your housing needs and make plans - today - to ensure you get what you want in the future.
Posted on
May 3, 2020
by
Warren Shouldice
During this trying time, it’s not surprising that so many homeowners are anxious and exhausted. Perhaps you’ve been feeling the same way. If so, keep in mind that the COVID-19 outbreak will eventually wind down and, hopefully, things will be back to normal soon.
We’re all in this together - and we’ll get through it!
Market Update:
After the first full month with social distancing measures in place, the housing market is adjusting to the effects of COVID-19. April sales hit 573 units, a decline of 63 per cent over last year. Prices for the average home are on the decline as well, reflected by the benchmark price, which fell by nearly two per cent compared to last year. New listings this month totalled 1,425 units, a decline of 54 per cent compared to last year. Inventories also declined, but with 5,565 units available, they remained high enough to push the months of supply above nine months. The economic impact of the situation is significant and early indications point toward more job losses and higher unemployment rates.
Challenges in the housing market are expected to persist throughout this year.
Detached:
Detached sales eased by 63 per cent this month compared to last year, with the largest decline in the West district.
• Slower demand was also met with easing supply, as new listings declined by 57 per cent. Overall, inventories eased by 25 per cent compared to last year. Despite the decline in inventory, the months of supply rose to more than eight months.
• The detached benchmark price eased by one per cent over last year, totalling $479,100. Prices managed to remain flat in both the South and South East districts. The highest price decline was in the City Centre, with a drop of more than three per cent.
Attached:
Semi-detached and row properties recorded a significant drop in sales and new listings, causing inventories to decline by nearly 20 per cent. However, with a combined inventory of 1,441 units compared to just 138 sales, the months of supply rose to over 10 months.
• Semi-detached prices eased across all districts for a citywide year-over-year decline of nearly three per cent. The City Centre recorded the largest year-over-year decline at four per cent.
• Row prices declined in all areas except the East district. Citywide row prices declined by more than two per cent for a total of $278,300.
Apartment:
Apartment sales slowed to 95 units. This is a 62 per cent decline over last year. New listings also slowed, but it was not enough to support a larger decline in inventory levels, which only eased by 13 per cent compared to last year. With 1,349 units in inventory, the months of supply rose to 14 months.
• Condominium prices were falling before recent developments in the market and the pace of decline remained relatively unchanged at more than two per cent compared to last year. Since the first energy crisis in 2014, the citywide apartment benchmark price has declined by nearly 19 per cent.
• Year-over-year prices have eased across almost all districts, but the South East district saw the largest year-over-year decline this month at nearly six per cent.
Quick Stats:
| |
April 2019
|
April 2020
|
Y/Y% change
|
|
Detached
|
|
|
|
|
Total sales
|
927
|
340
|
-63.32%
|
|
Inventory
|
3,701
|
2,775
|
-25.02%
|
|
Months of supply*
|
3.99
|
8.16
|
104.43%
|
|
Average DOM
|
49
|
50
|
1.66%
|
|
Benchmark price**
|
$484,200
|
$479,100
|
-1.05%
|
| |
|
|
|
|
Attached
|
|
|
|
|
Total sales
|
367
|
138
|
-62.40%
|
|
Inventory
|
1,829
|
1,441
|
-21.21%
|
|
Months of supply*
|
4.98
|
10.44
|
109.53%
|
|
Average DOM
|
62
|
63
|
2.28%
|
|
Benchmark price**
|
$315,400
|
$307,400
|
-2.54%
|
| |
|
|
|
|
Apartment
|
|
|
|
|
Total sales
|
250
|
95
|
-62.00%
|
|
Inventory
|
1,549
|
1,349
|
-12.91%
|
|
Months of supply*
|
6.20
|
14.20
|
129.18%
|
|
Average DOM
|
68
|
64
|
-5.68%
|
|
Benchmark price**
|
$249,800
|
$244,400
|
-2.16%
|
*Months of supply: The ratio between inventory and sales which represents the current pace of sales and how long it would take to clear existing inventory.
**Benchmark price: The monthly price of the typical home based on its attributes, providing the best measure of price trends.
Estimating Your Selling Costs
When the time comes to sell your house, you’ll want to determine roughly how much you can expect to net after the sale. To figure that out, you’ll not only need to know how much your house will likely sell for, but also the selling costs you are likely to incur in the process.
The costs of selling vary depending on a number of factors. Here’s a general rundown of what to consider:
- Repairs. You will want your house to look its best to buyers. That may require you to get any needed repairs done before listing. You don’t want a buyer to see a dent in the wall or a dripping faucet.
- Renovations. It might make sense to get a few improvements done to make the house more attractive. For example, you may want to replace old and worn kitchen countertops.
- Legal fees. Selling a house requires a lot of legal work. You’ll need a good real estate lawyer to take care of that for you.
- Commissions. This is usually calculated as a percentage of the sale price.
- Moving costs. Once you sell, you’ll obviously need to move! So, factoring in this expense is a smart idea.
Although this may seem like a long list, selling costs are fairly easy to estimate. Once you have that number, it’s easy to calculate how much money you’ll have available to put towards your next home.
Posted on
April 5, 2020
by
Warren Shouldice
The COVID-19 outbreak has created a new reality for all of us, at least temporarily. Chances are you’re dealing with many new challenges, both personally and professionally. We all are.
Now, it’s up to each of us to do our part so we can get through this as quickly as possible. Remember, we’re all in this together. Stay positive and know that things will get better. In the meantime, you might have immediate concerns about the real estate market. For example, you might be wondering if you should put off moving. Or, you might need to move but are worried about all this uncertainty.
If so, give me a call. As a real estate professional, I have the latest market information, insights and tools - and can give you sound advice. Good information and advice are often the antidote to stress, especially during challenging times. So, please, don’t hesitate to reach out to me.
Take care and stay well.
Market Update:
After a strong start to 2020, economic conditions have dramatically changed, as COVID-19 is impacting all aspects of society. The economic impact is starting to be felt across many industries. This includes the housing market. March sales activity started the month strong, but quickly changed, as concerns regarding the spread of COVID-19 brought about social distancing measures. By the end of the month, sales activity had fallen 11 per cent compared to last year. This is 37 per cent lower than longterm averages. The drop in sales pushed March levels to the lowest recorded since 1995. There was also a large reduction in new listings, almost entirely during the second half of the month. The reduction in new listings should help prevent significant price declines in the market. However, price declines will likely be higher than originally expected due to the combined impact of the pandemic and energy sector crisis.
Quick Stats:
| |
March 2019
|
March 2020
|
Y/Y% change
|
|
Detached
|
|
|
|
|
Total sales
|
816
|
691
|
-15.32%
|
|
Inventory
|
3,397
|
2,829
|
-16.72%
|
|
Months of supply*
|
4.16
|
4.09
|
-1.66%
|
|
Average DOM
|
57
|
47
|
-16.42%
|
|
Benchmark price**
|
$481,500
|
$480,800
|
-0.15%
|
| |
|
|
|
|
Attached
|
|
|
|
|
Total sales
|
322
|
269
|
-16.46%
|
|
Inventory
|
1,718
|
1,525
|
-11.23%
|
|
Months of supply*
|
5.34
|
5.67
|
6.26%
|
|
Average DOM
|
66
|
60
|
-8.82%
|
|
Benchmark price**
|
$314,000
|
$310,500
|
-1.11%
|
| |
|
|
|
|
Apartment
|
|
|
|
|
Total sales
|
189
|
217
|
14.81%
|
|
Inventory
|
1,496
|
1,428
|
-4.55%
|
|
Months of supply*
|
7.92
|
6.58
|
-16.86%
|
|
Average DOM
|
74
|
59
|
-20.10%
|
|
Benchmark price**
|
$249,600
|
$243,700
|
-2.36%
|
*Months of supply: The ratio between inventory and sales which represents the current pace of sales and how long it would take to clear existing inventory.
**Benchmark price: The monthly price of the typical home based on its attributes, providing the best measure of price trends.
Help Buyers Understand the Area
There’s a famous saying in the real estate business: “Location, location, location”. It simply means that where your home is located - your neighbourhood - is just as important to potential buyers as the features of the property itself.
Sellers often make the mistake of creating a long list of home features while ignoring neighbourhood features. They tout the spacious kitchen, and the newly renovated bathrooms, but say little about the area.
So, when you’re ready to sell your home, sit down and create two lists: home features and neighbourhood features. Buyers want to know both.
On the neighbourhood features list, include:
- Locations of schools and daycare centres.
- Major retailers and shopping centres.
- Proximity to major commuting routes.
- Theatres, night clubs and other entertainment.
- Rinks, gyms and other sporting facilities.
- Green space, walking trails, and ponds.
When buyers have their eyes on two properties which are comparable in features, the neighbourhood is often the deciding factor.
Posted on
February 19, 2020
by
Warren Shouldice
Housing market conditions continue to follow similar trends to last year, with gains in sales. At the same time, there have been further reductions in new listings, inventory and more declines in prices. January sales activity was 863 units, nearly eight per cent higher than last year’s levels. While sales remained well below January activity recorded before 2014, they remain consistent with activity recorded over the past five years. “A persistent slowdown in the energy sector has resulted in a reset in many aspects of our economy. This includes the housing market,” said CREB® chief economist Ann-Marie Lurie. “We continue to see the slow adjustment to more balanced conditions, but it will take time before that starts to translate into price stability.” Citywide unadjusted benchmark prices were $417,100 in January. This is slightly lower than the previous month and nearly one per cent lower than last year’s levels. Benchmark prices eased, but there were some modest improvements in both the average and median prices. This is likely a reflection of some changes in the distribution of sales.
Detached
• New listings declined by nearly 11 per cent due to pullbacks in all areas except the City Centre and the North districts. Combined with adjustments in sales, this caused inventories to ease by 15 per cent citywide.
• Reductions in supply and gains in sales supported reductions in the months of supply from nearly six months last year to just under five months this January.
• Detached benchmark prices eased by nearly one per cent compared to last year. However, the only two areas to record notable year-over-year declines were the City Centre and West, with price declines exceeding three per cent.
Apartment
• Improving sales were met with gains in new listings, causing inventories to increase by 12 per cent compared to last year.
• The gain in inventories prevented any significant adjustment in the months of supply, which remained elevated at nine months.
• The persistent oversupply continued to weigh on benchmark prices, which eased compared to last month and declined by two per cent compared to last year.
Attached
• Despite slower sales in the South and South east district, city-wide attached sales improved by four per cent. At the same time new listings eased by nearly 18 per cent, causing inventories to decline by ten per cent.
• Improving sales and a drop in inventory helped the months of supply to dip below seven months, a significant improvement compared to last year’s level of nearly eight months.
• While this segment is trending toward more balanced conditions, persistent oversupply continues to weigh on prices, which trended down over the previous month and eased by over one per cent compared to last year’s levels.
Quick Stats
| |
Jan. 2019
|
Jan. 2020
|
Y/Y% change
|
|
Detached
|
|
|
|
|
Total sales
|
486
|
517
|
6.38%
|
|
Inventory
|
2,844
|
2,411
|
-15.23%
|
|
Months of supply*
|
5.85
|
4.66
|
-20.31%
|
|
Average DOM
|
67
|
61
|
-8.18%
|
|
Benchmark price**
|
$482,000
|
$479,600
|
-0.50%
|
| |
|
|
|
|
Attached
|
|
|
|
|
Total sales
|
191
|
199
|
4.19%
|
|
Inventory
|
1,474
|
1,320
|
-10.45%
|
|
Months of supply*
|
7.72
|
6.63
|
-14.05%
|
|
Average DOM
|
77
|
76
|
-1.98%
|
|
Benchmark price**
|
$313,500
|
$309,600
|
-1.24%
|
| |
|
|
|
|
Apartment
|
|
|
|
|
Total sales
|
124
|
147
|
18.55%
|
|
Inventory
|
1,178
|
1,323
|
12.31%
|
|
Months of supply*
|
9.50
|
9.00
|
-5.26%
|
|
Average DOM
|
81
|
77
|
-4.37%
|
|
Benchmark price**
|
$251,100
|
$245,900
|
-2.07%
|
*Months of supply: The ratio between inventory and sales which represents the current pace of sales and how long it would take to clear existing inventory.
**Benchmark price: The monthly price of the typical home based on its attributes, providing the best measure of price trends.
Are You Ready to Buy Up?
No matter how much you love your current home, you may still be dreaming of the day you can buy up into a better home in a better neighbourhood. Is that day today or a few years down the road? Here’s a quick way to make that assessment.
First, make a list of all the practical reasons why it might be time to move up. Those reasons might include features such as: more bedrooms; proximity to work and school; a larger backyard with trees; nearby parks and walking paths; and, better access to things you enjoy.
Next, make a list of the emotional reasons for making such a move. Those reasons might include memorable get-togethers with friends on a more spacious deck; an easier and less stressful commute to work; more family time with the kids; and, enjoyable Saturday golf at a nearby course.
Finally, take a financial snapshot to determine if you can afford to move up. You’ll need to get a good idea of what your current property will sell for in today’s market, the average price of homes in your desired neighbourhood, and how much mortgage you can afford.
Once you have all of that down on paper, you’ll have a clear picture of your readiness. If the practical and emotional reasons for buying up are compelling, and you can afford to make the move, then, you have your answer.
By the way, if you need help in making this determination - especially figuring out what your home will likely sell for, call today.
Posted on
January 5, 2020
by
Warren Shouldice
December sales improved to levels more consistent with activity recorded over the past five years. This follows weak sales activity last year. A stronger second half in 2019 was enough to push annual sales up by one per cent. “Price declines, lower mortgage rates and some modest improvements in full-time employment helped support some demand growth in the city. Reductions in supply are also contributing to the slow adjustment to more stable conditions in the housing market,” said CREB® chief economist Ann-Marie Lurie. “As oversupply in the market continues to ease, we should start to see more stabilization in prices. However, conditions continue to favour the buyer and this is weighing on prices.” December unadjusted benchmark prices were $418,500. This is just slightly lower than last month and one per cent below last year’s levels. Overall prices in 2019 declined by three per cent over last year’s levels. The total adjustment in prices is a 10 per cent decline since the 2014 slowdown in the energy sector. While there are signs of stabilization, conditions vary significantly by location, price range and product type. Improvements in the resale market have been mostly driven by lower priced product or areas where price declines were enough to bring more purchasers back into the market.
Quick Stats:
| |
Dec. 2018
|
Dec. 2019
|
Y/Y% change
|
|
Detached
|
|
|
|
|
Total sales
|
496
|
504
|
1.61%
|
|
Inventory
|
2,598
|
2,210
|
-14.93%
|
|
Months of supply*
|
5.24
|
4.38
|
-16.28%
|
|
Average DOM
|
66
|
64
|
-2.86%
|
|
Benchmark price**
|
$486,200
|
$480,100
|
-1.25%
|
| |
|
|
|
|
Attached
|
|
|
|
|
Total sales
|
193
|
220
|
13.99%
|
|
Inventory
|
1,288
|
1,190
|
-7.61%
|
|
Months of supply*
|
6.67
|
5.41
|
-18.95%
|
|
Average DOM
|
74
|
66
|
-11.62%
|
|
Benchmark price**
|
$317,800
|
$311,300
|
-2.05%
|
| |
|
|
|
|
Apartment
|
|
|
|
|
Total sales
|
105
|
134
|
27.62%
|
|
Inventory
|
1,030
|
1,131
|
9.81%
|
|
Months of supply*
|
9.81
|
8.44
|
-13.96%
|
|
Average DOM
|
74
|
72
|
-2.15%
|
|
Benchmark price**
|
$251,200
|
$248,800
|
-0.96%
|
*Months of supply: The ratio between inventory and sales which represents the current pace of sales and how long it would take to clear existing inventory.
**Benchmark price: The monthly price of the typical home based on its attributes, providing the best measure of price trends.
Three Lists to Make When Selling Your Home
When you put your property up for sale, you want to make sure that potential buyers get all the information they need on the features of your home and its surrounding area. If, for example, buyers don’t realize there is a great school just a couple of blocks away, they might cross your property off their shortlist.
An effective way to make sure something like that doesn’t happen is to create three lists.
#1: The “I’ll miss it” list. Chances are, there are things about your home that you’re really going to miss when you move. One of those may be the spacious living room that’s ideal for entertaining or the nearby park with scenic trails that are perfect for walking and biking. Whatever you’ll miss, put it on the list! Chances are, those are features that will also interest buyers.
#2: The “Just the facts” list. What are the facts about your property that a buyer needs to know in order to consider purchasing it? This may be a very long list including such items as total square footage, number of bedrooms, number of bathrooms, property taxes, size of yard, and more.
#3: The “repairs and improvements” list. Buyers are interested in the state of repair of your home, and in any improvements you have made to it. On this list include all repairs you have done during the past three years and, if possible, attach receipts. It’s especially important to include anything that has been replaced, such as the furnace or roof shingles.
Posted on
December 8, 2019
by
Warren Shouldice
The best part of the season is remembering those who make the holidays meaningful. We wish you all the love and happiness this season can bring, and may it follow you throughout the coming new year.
Happy Holidays & Best Wishes!
Market Update
Year-to-date residential sales in the city remain just above last year’s levels mainly due to improvements in the attached sector so far this year. However, November sales activity eased over last year’s levels, mostly due to pullbacks in the apartment sector. Meanwhile, new listings eased enough relative to sales to cause inventories to ease and the amount of oversupply to come down slightly compared to last year’s levels. As of November, the citywide unadjusted benchmark price was $419,100. This is just below last month’s levels and two per cent lower than last year’s levels. Market conditions continue to vary depending on price, location and product type. For example, prices have ranged from a year-to-date decline of nearly eight per cent for row product in the East district to a two per cent increase for semidetached product in the North district. Larger price declines are often caused by high supply in the new-home and resale markets relative to demand.
Quick Stats
| |
Nov. 2018
|
Nov. 2019
|
Y/Y% change
|
|
Detached
|
|
|
|
|
Total sales
|
680
|
710
|
4.41%
|
|
Inventory
|
3,506
|
2,928
|
-16.49%
|
|
Months of supply*
|
5.16
|
4.12
|
-20.01%
|
|
Average DOM
|
60
|
61
|
2.44%
|
|
Benchmark price**
|
$491,400
|
$481,500
|
-2.01%
|
| |
|
|
|
|
Attached
|
|
|
|
|
Total sales
|
253
|
262
|
3.56%
|
|
Inventory
|
1,703
|
1,524
|
-10.51%
|
|
Months of supply*
|
6.73
|
5.82
|
-13.58%
|
|
Average DOM
|
70
|
69
|
-0.81%
|
|
Benchmark price**
|
$322,000
|
$311,200
|
-3.35%
|
| |
|
|
|
|
Apartment
|
|
|
|
|
Total sales
|
239
|
188
|
-21.34%
|
|
Inventory
|
1,325
|
1,406
|
6.11%
|
|
Months of supply*
|
5.54
|
7.48
|
34.90%
|
|
Average DOM
|
65
|
74
|
13.37%
|
|
Benchmark price**
|
$252,400
|
$247,900
|
-1.78%
|
*Months of supply: The ratio between inventory and sales which represents the current pace of sales and how long it would take to clear existing inventory.
**Benchmark price: The monthly price of the typical home based on its attributes, providing the best measure of price trends.
Selling Your Home Doesn't Need to be Overwhelming
When people think about selling their home, many focus on all the things they will have to do: paint the kitchen; clean closets; prepare for viewings; find another home; arrange financing; start packing; etc. It can all seem very overwhelming, very quickly.
In fact, if you focus on the long to-do list, you may be dissuaded from ever making a move! It doesn’t have to be that way.
There are many ways to make selling your home and buying another one relatively simple and easy. Sure, there will be some work to do. You may need to prepare your property so that it looks appealing to potential buyers - cleaning, decluttering, doing some repairs, etc. Of course, you will also need to view some properties for sale in order to find your next dream home. But those activities may not be as time-consuming or difficult as you had imagined. In fact, you and your family might actually enjoy the experience - and see it as an adventure.
Posted on
August 11, 2019
by
Warren Shouldice
For the fourth consecutive month, inventories in the market declined compared to last year. This is due to the combination of improving sales and a decline in new listings. The market continues to favour the buyer, but a continuation in supply reduction compared to sales is needed to support more balanced conditions. Year-to-date sales activity remains just below last year’s levels and well below longer-term averages. However, the reduction in inventory has caused the months of supply in July to ease to 4.5 months, a significant improvement from the 5.5 months recorded last year. With less oversupply in the market, prices are showing some signs of stability on a monthly basis. This is causing the rate of price declines to ease on a year-over-year basis. Overall, year-to-date benchmark prices remain over four per cent below last year’s levels.
Quick Stats:
| |
July 2018
|
July 2019
|
Y/Y% change
|
|
Detached
|
|
|
|
|
Total sales
|
968
|
1,003
|
3.62%
|
|
Inventory
|
4,592
|
3,806
|
-17.12%
|
|
Months of supply*
|
4.74
|
3.79
|
-20.01%
|
|
Average DOM
|
49
|
50
|
2.63%
|
|
Benchmark price**
|
$504,600
|
$488,400
|
-3.21%
|
| |
|
|
|
|
Attached
|
|
|
|
|
Total sales
|
325
|
352
|
8.31%
|
|
Inventory
|
2,100
|
1,709
|
-18.62%
|
|
Months of supply*
|
6.46
|
4.86
|
-24.86%
|
|
Average DOM
|
54
|
67
|
24.06%
|
|
Benchmark price**
|
$330,700
|
$318,300
|
-3.75%
|
| |
|
|
|
|
Apartment
|
|
|
|
|
Total sales
|
254
|
291
|
14.57%
|
|
Inventory
|
1,781
|
1,664
|
-6.57%
|
|
Months of supply*
|
7.01
|
5.72
|
-18.45%
|
|
Average DOM
|
62
|
79
|
28.05%
|
|
Benchmark price**
|
$258,200
|
$249,900
|
-3.21%
|
*Months of supply: The ratio between inventory and sales which represents the current pace of sales and how long it would take to clear existing inventory.
**Benchmark price: The monthly price of the typical home based on its attributes, providing the best measure of price trends.
How To Minimize Water Damage
It’s amazing how much damage water can cause. Just two gallons of water from a burst pipe or overflowing toilet can wreak havoc throughout your home and necessitate thousands of dollars in repairs!
What should you do at the first sign of water leakage?
First, stop the source. Turn off the nearest water valve. If you can’t find it, turn off the main water valve to your home. Next, do everything you can to soak up as much water as possible. If necessary, lift carpeting. Pay particular attention to water settling next to walls or inside ductwork. Get these areas dry as quickly as possible. Contain the water. This is important. Do your best to prevent water from infiltrating other rooms to prevent further damage. Once the area is as dry as possible, run fans in the room along with a good dehumidifier - for at least a full day - to draw in the remaining moisture.
If, despite your best efforts, you suspect that moisture remains inside the walls, floors or ceilings, call in the professionals. There are many companies that specialize in emergency water damage control. The key is to prevent the possibility that remaining moisture will provide an environment for mould to grow. Also, consider contacting your insurance company. They’re as motivated as you are to reduce the damage.
Gentle Ways to Deal with Insects in the Home
A growing number of homeowners are uncomfortable using traditional pesticides for a variety of reasons, including health and environmental concerns. If you’re among them, here are some natural ways to deal with insects in your home:
- Use a mixture of unsweetened lemon juice and water to deter spiders. Spray the solution near doorways and window sills where these arachnoids can enter.
- Combine an equal mixture of vinegar and water to create an effective deterrent for a variety of crawling insects, particularly ants. Spray the solution on floors and countertops that are close to these creatures’ food sources.
- Believe it or not, invest in a fake wasp nest (which you can purchase at your local home improvement store) to deter real wasps from building a nest on your property.
- Experts recommend that you test any surface spray you plan to use to make sure it doesn’t stain or otherwise harm the surface.
Posted on
July 6, 2019
by
Warren Shouldice
Summer is finally here and that’s great news for those of us who enjoy spending time in the great outdoors! Whether you prefer sports or leisure activities - or ambitious do-it-yourself projects - here’s hoping the days unfold just the way you wish.
Some of the best summer days are spent getting together with family and friends for fun, food, refreshments and relaxing conversation. If your discussions turn to real estate, I sincerely hope you will refer me to your friends and family for general inquiries or any specific questions they may have. I appreciate it when you let others know that I’m available to assist them as I would assist you.
Have a wonderful summer!
Market Update:
New listings coming onto the market continued to decline in June, which is helping to reduce oversupply. Year-over-year, new listings saw a decrease of nearly 19 per cent. Sales activity slowed this month compared to last year by six per cent, but the pullback in new listings was enough to cause inventories to fall by 15 per cent compared to last year’s elevated levels. Although conditions have improved in recent months, most areas and price points are still experiencing "buyers market" conditions.
Quick Stats:
| |
June 2018
|
June 2019
|
Y/Y% change
|
|
Detached
|
|
|
|
|
Total sales
|
1,209
|
1,100
|
-9.02%
|
|
Inventory
|
4,816
|
3,961
|
-17.75%
|
|
Months of supply*
|
3.98
|
3.60
|
-9.60%
|
|
Average DOM
|
41
|
49
|
19.53%
|
|
Benchmark price**
|
$507,100
|
$488,900
|
-3.59%
|
| |
|
|
|
|
Attached
|
|
|
|
|
Total sales
|
394
|
418
|
6.09%
|
|
Inventory
|
2,137
|
1,790
|
-16.24%
|
|
Months of supply*
|
5.42
|
4.28
|
-21.05%
|
|
Average DOM
|
51
|
62
|
22.42%
|
|
Benchmark price**
|
$332,900
|
$317,300
|
-4.69%
|
| |
|
|
|
|
Apartment
|
|
|
|
|
Total sales
|
292
|
262
|
-10.27%
|
|
Inventory
|
1,877
|
1,790
|
-4.64%
|
|
Months of supply*
|
6.43
|
6.83
|
6.28%
|
|
Average DOM
|
59
|
71
|
20.55%
|
|
Benchmark price**
|
$258,300
|
$250,200
|
-3.14%
|
*Months of supply: The ratio between inventory and sales which represents the current pace of sales and how long it would take to clear existing inventory.
**Benchmark price: The monthly price of the typical home based on its attributes, providing the best measure of price trends.
5 Things Buyers Hate to See
When you show your home to prospective buyers, there is probably a long list of things you’re hoping they’ll notice. For example, you’ll want them to see the beautiful chandelier in the foyer or the spacious backyard and large deck, or the kitchen with the island big enough for a whole family to sit down for breakfast.
But what about those things you’re hoping buyers will not notice?
Every home has some features that are less than enticing to the typical buyer. You may not be able to do much about a small kitchen or a home backing onto a noisy main street.
However, there are several things buyers don’t want to see that you can change. Here are five of the most common:
- Clutter. Closets stuffed full of clothes or rooms crammed with too much furniture are distractions. Clutter of any kind makes buyers feel uneasy - and gets in the way of showcasing the wonderful features of your home.
- Maintenance issues. Buyers definitely don’t want to see a lot of things that need repairs or replacement, such as dripping faucets, faded or chipped walls, or overgrown lawns and shrubbery.
- Smells. Of course, you can’t see smells. But buyers will notice the lingering aroma of exotic cooking, cigarette smoke, and pets. These smells may even limit the amount of time they want to spend exploring the home.
- Personal items. Buyers will understand that a family is living in the home they’re viewing. However, constant reminders - in the form of vacation pictures, trophies, or scattered children’s toys - can make a buyer feel like an intruder.
- You. It’s nothing personal, but buyers prefer to view your home without you in it.
Fortunately, all these things can be easily dealt with before you show your home.
How a Home Inspection Helps You
Whether you’re considering buying a particular home, selling your current property - or doing both - a home inspection can help.
This inspection is conducted by a qualified professional who takes a close look at every aspect of a home - structure, wiring, plumbing, and more - and identifies issues you may not have noticed yourself.
For example, a home inspector can determine that a furnace will need to be replaced soon, or that there is a water leak that needs to be fixed.
You’ll definitely want to get a professional home inspection before you buy a particular property. That’s why most offers to purchase a home are conditional upon passing a home inspection. (The last thing you want is to buy your dream home only to discover that the wiring needs to be updated!)
Need to find a reputable home inspector? Call me today for a recommendation.
Posted on
June 7, 2019
by
Warren Shouldice
Sales growth in May along with a decline in new listings helped to ease pressure on inventory levels, which finished the month at 7,467 units, a decline of 12 per cent compared to last year. Improving sales relative to inventory levels caused the months of supply to ease to just under four months. While still oversupplied, this is an improvement from the five months of supply recorded last May. Citywide sales in May totalled 1,921 units, 11 per cent higher than last year’s levels. However, sales remain 10 per cent below longer-term trends. This sales growth was primarily driven by homes prices under $500,000. Citywide benchmark prices totalled $424,600 in May. While prices have shown some signs of improvement month-over-month, they still remain four per cent lower than 2018 levels.
Quick Stats:
| |
May. 2018
|
May. 2019
|
Y/Y% change
|
|
Detached
|
|
|
|
|
Total sales
|
1,059
|
1,182
|
11.61%
|
|
Inventory
|
4,504
|
3,921
|
-12.94%
|
|
Months of supply*
|
4.25
|
3.32
|
-22.00%
|
|
Average DOM
|
40
|
50
|
24.35%
|
|
Benchmark price**
|
$507,800
|
$487,900
|
-3.92%
|
| |
|
|
|
|
Attached
|
|
|
|
|
Total sales
|
384
|
424
|
10.42%
|
|
Inventory
|
2,030
|
1,893
|
-6.75%
|
|
Months of supply*
|
5.29
|
4.46
|
-15.55%
|
|
Average DOM
|
51
|
61
|
20.95%
|
|
Benchmark price**
|
$333,900
|
$316,800
|
-5.12%
|
| |
|
|
|
|
Apartment
|
|
|
|
|
Total sales
|
282
|
315
|
11.70%
|
|
Inventory
|
1,924
|
1,653
|
-14.09%
|
|
Months of supply*
|
6.82
|
5.25
|
-23.09%
|
|
Average DOM
|
59
|
70
|
17.61%
|
|
Benchmark price**
|
$255,600
|
$248,200
|
-2.90%
|
*Months of supply: The ratio between inventory and sales which represents the current pace of sales and how long it would take to clear existing inventory.
**Benchmark price: The monthly price of the typical home based on its attributes, providing the best measure of price trends.
Flexible Dumpsters for Home Renos
New synthetic fabric dumpsters offer a flexible method of holding and disposing of renovation waste - without the need to order a large and unsightly metal bin that sits on your front lawn or driveway for weeks on end. The industry calls them FIBC’s, or Flexible Intermediate Bulk Containers, but they’re more commonly known as big bags, bulk bags, bagsters and super sacks.
These durable trash containers can be purchased and taken home (or delivered) for indefinite use, then picked up for a preset fee when full. When the bag is picked up, another bag is dropped off. Available through specialty suppliers or through some home renovation stores, these “soft bins” are easy to move when empty, and they take up much less space than large metal dumpsters. They also take much less time to fill up, so you’ll have a tidier renovation site and less of an eyesore on your property.
|


